Step by Step process to identify Failure modes in distributed systems.
In this post, we will be focusing on the process to identify possible failures in distributed systems.
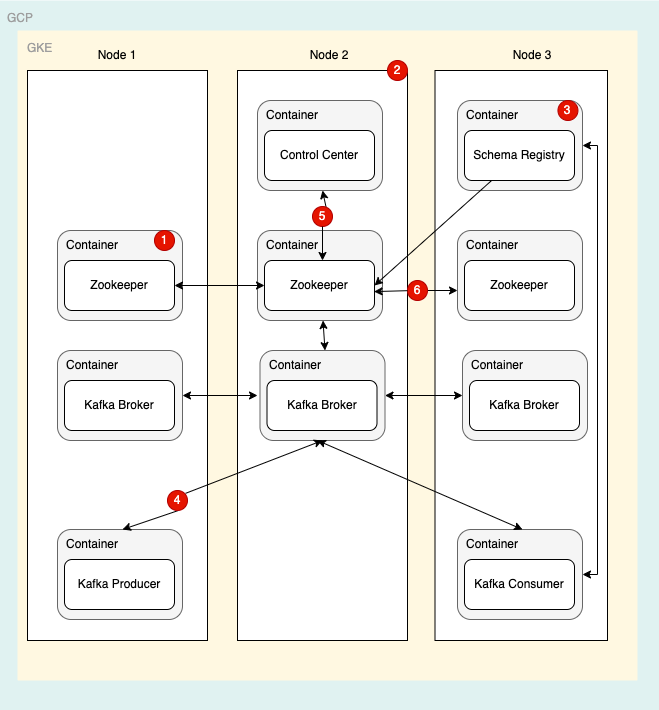
I will use an example application architecture to detail out the steps to identify failure modes and their respective priorities.
By the end of this article, you will get a step by step guide on how to brainstorm for failure modes and a framework to list and priorities failure modes for any application architecture

Let’s begin, shall we?
Step 1 :
Understand the application architecture, and have its functional and nonfunctional requirements handy. I know it sounds obvious, but, I cannot emphasize it more on it.

Step 2:
Start with the topmost layer of the architecture. “The application Layer”.
This activity should be a team effort, including application developers who have created or holds the knowledge of the applications which are deployed. Architects who have designed the system. network engineers for connectivity etc. Having layered architecture will allow us to include responsible people for each layer.
Step 3:
Make a list of each layer and component of the architecture.
I will use a mind-map tool to brainstorm failure modes for each component in the architecture.
In this article, we will use an “Example application architecture” mentioned above and break it into a mind-map.

Starting with the Application Layer, we will require application developers and Dev-Ops engineers for brainstorming the application layer failure modes

Step 4:
Focus on one component at a time.
We will detail out the possible failures of Kafka brokers and the rest of the components in sequence.

The above list of failures for Kafka brokers is by no means an exhaustive list. But the process for detailing out possible failures will be the same for each component.
Schema registry failures

Control Center failures

Once we are done with application layer failure our mind-map would look like the below tree

After finishing brainstorming for each layer, we should be able to capture most of the failure modes.

Step 5:
List down all the failure mode, brainstormed in the above exercise in a worksheet having columns mentioned below.
We have already discussed the significance of each column in the last post.

Step 6:
List down the technical impacts of each failure mode.
Usually, there is a set of failure modes that are common to all the components in the architecture, For example, failures related to resources like memory, CPU, disk etc.
Step 7:
Categorise common failure modes into the worksheet.
Why categorising you ask ?
Good question. Categorisation allows you to consolidate steps to fix common failures into one document (runbook), which can be used by SRE or the support team.
Step 8:
Execute failure modes as per the priority defined by the business.
While conducting failure modes on any layer of the architecture, you will notice the impact on the application layer.
Step 9:
Capture error and warning logs while executing failure scenarios.
Capturing errors and logs will allow you to create monitoring requirements for the system. While executing the failure modes, please document the process to resolve the respective failure.
Documents produced in this process will be used by the support or SRE team to resolve a similar failure.
Step 10:
Collaborate with business to prioritize the failure modes as per functional and nonfunctional impact.
The logical next after executing failure modes is to implement detective and prevention measures on the system.
It leads us to the next post in the series of FMECA. Implementation of alerting and monitoring for the failure modes.
